 NIOZ high-resolution temperature sensors: Internal wave – Turbulence studies
Earth’s main energy supplier the Sun stores large amounts of heat in the ocean (some 10,000 times man-kinds’ present-day energy consumption). This results in a statically stable vertical stratification or layering of horizontal density interfaces. Colder (saltier) waters are denser than warmer (fresher) waters. The stratification supports ‘internal waves’ that constantly set in motion the density interfaces. Paradoxically, internal waves are thus the dominant mechanical means to transport heat and stratification into the deep ocean: They help maintaining their own medium.
Internal waves have different dimensions than wind-driven surface waves. Their periodicities range between about 10 minutes and 1 day (surface waves: 10 s). Their vertical excursions are commonly 10 m and can grow over 100 m (surface waves: 1-10 m). Horizontal dimensions of internal and surface waves roughly match, as typical wavelengths are 100-1000 m. There are two main mechanical sources that set the interior density stratification in motion. 1. Horizontal tidal motions interact with sea floor topography like seamounts, ridges and continental slopes: The resulting vertical tidal component forces the density layers into motion. 2. Any passage of atmospheric or oceanic ‘fronts’ (horizontal density gradients) in combination with the Earth rotation leave behind ‘inertial motions’ or near-circular near-horizontal internal waves. Both sources generate low-frequency internal waves with periods of about half a day to one day (the inertial period depends on latitude). Their energy is thought to cascade to higher frequency near-vertical internal waves that have periods up to the buoyancy frequency determined by the stratification. In addition, flow over small-scale topography may directly generate internal waves close to the buoyancy frequency.
At the lower bound of internal wave frequencies, inertial motions have relatively short vertical scales and dominate the stratification-destabilizing vertical current ‘shear’. Thereby they are a main actor in the loss, ‘dissipation’, of internal wave energy in the ocean interior. Breaking internal waves can also lose their energy at the borders of the ocean, not so much at beaches but mainly at underwater topography. At some, relatively steep, slopes they cause magnificent surf of 100-m tall overturning breakers!
Internal wave breaking dominates the vertical exchange in the ocean. It also dominates resuspension of sediment at the sea 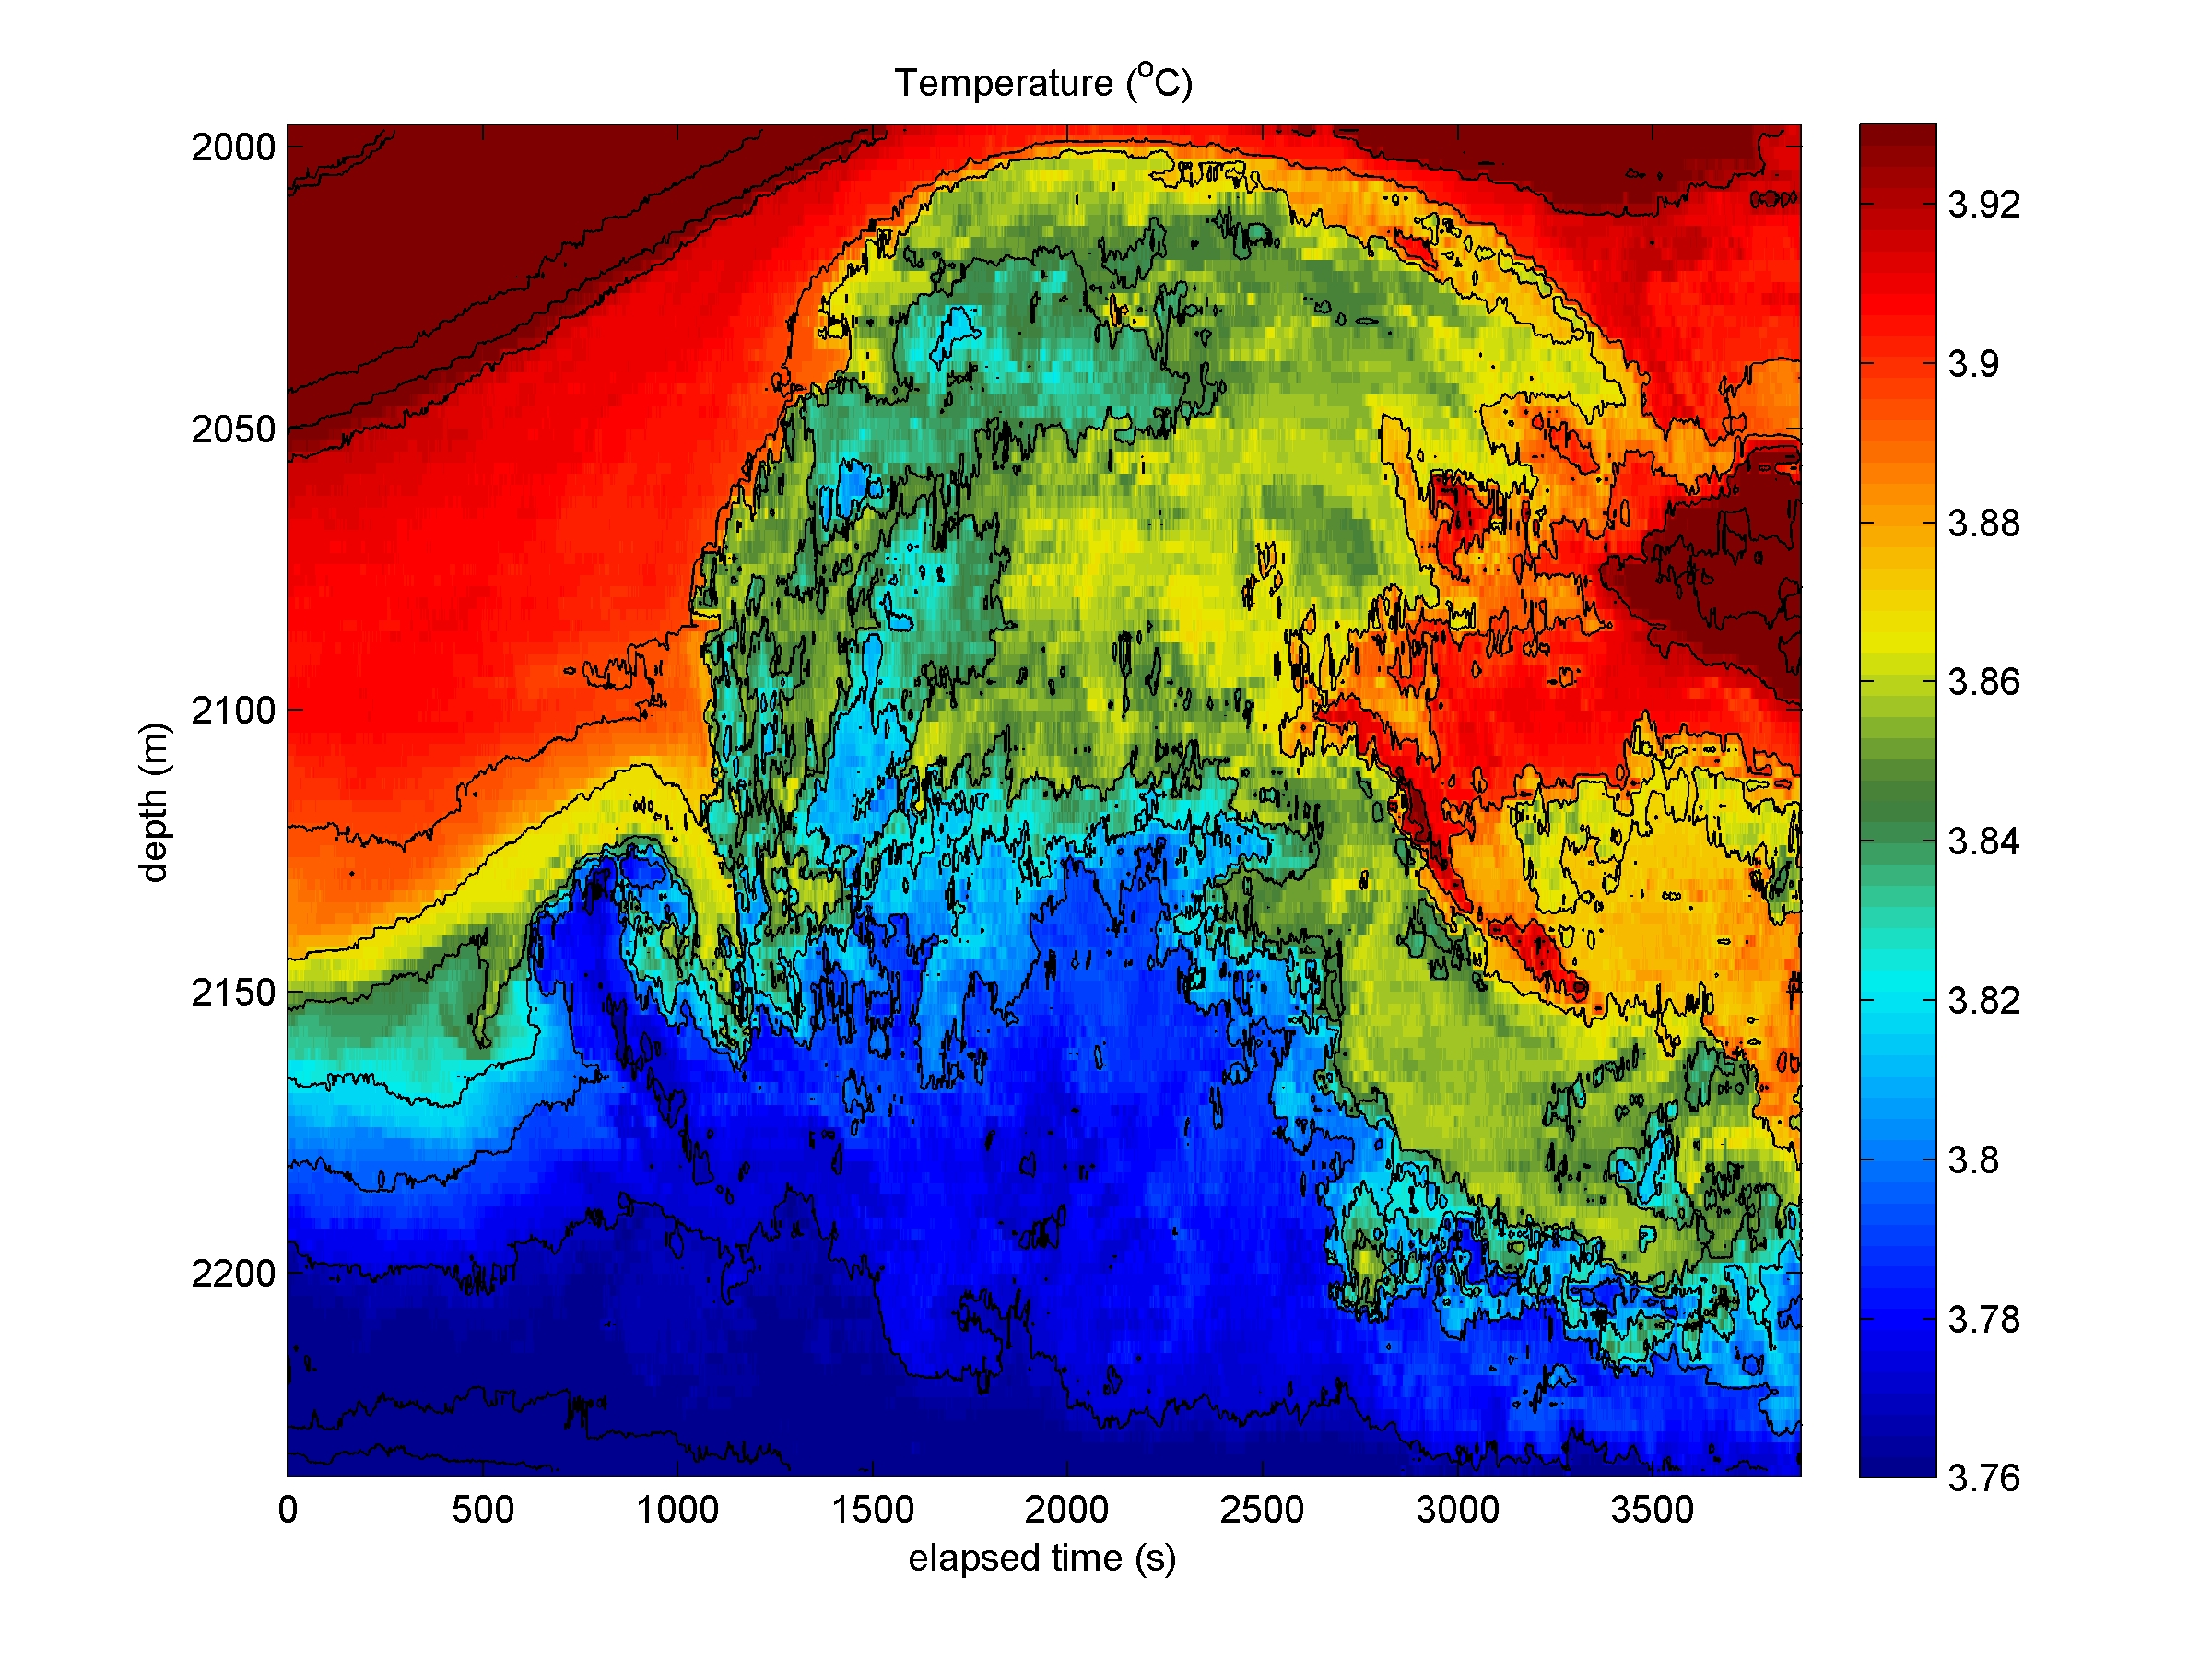 floor and the redistribution of nutrients. It is thus a key factor for ocean life. This exchange is always turbulent, at least 100 times and more commonly 1000-10,000 times molecular diffusion. Without turbulence organisms larger than micro-scales cannot breath and live. Nevertheless, ocean turbulence appears to be a slow process, like atmospheric turbulence (have a look at the deformation of clouds in the sky). Yet, the bulk Reynolds numbers that determine the transition from molecular to turbulent diffusion are always large (typically 100,000-1,000,000): The scales of geophysical domains are much larger than those of laboratory models.
—
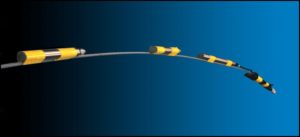
In order to observe quantitative details of internal wave-induced turbulence in the ocean one has to measure key dynamical parameters in sufficient detail. Given the vastness of the ocean, this is not easy. Ideally, dynamic pressure fluctuations are measured, but the expected relative values in the range of 10-100 Pa cannot be established to within a precision of less than 1 Pa using instrumentation in a somewhat flexible mooring array under huge environmental static pressures. The (indirect) dynamical parameter that can be best observed in the ocean is temperature. For studying internal waves and turbulence energy containing eddies one requires a resolution of halfway between the buoyancy scale and the Kolmogorov dissipation scale, over a range of largest breaking wave amplitude. Thus far, no instrument exists that can resolve all scales. In the 19nineties standard oceanographic moored equipment could resolve about 0.01°C temperature variations at a rate of once per minute for a period of about a month. At NIOZ it was decided to construct a temperature sensor that could measure at a rate of 1 Hz (100 times faster than the shortest buoyancy period and largest turbulence overturning Ozmidov scale while 100 times slower than the Kolmogorov scale), 10-100 times more precise (down to 0.0005°C with noise level below 0.0001°C) independently for a period of 1 year (to build sufficient statistics by being 100 times longer than the inertial period, outside the tropical regions). By mounting typically 100 sensors at 0.5-2 m vertical intervals, up to 100 m tall deep-ocean overturns are well resolved. The instrumentation is primarily suited for academic research on oceanic internal wave turbulence.
After several years of trials, NIOZ high-resolution temperature sensors from 1D-vertical moorings have revealed and quantified internal wave turbulence from various ocean areas. One way to present these data are through ‘slit’-videos. Slit-videos are constructed by plotting consecutive short range (15 min – 1 hour) frozen ‘non-developing’ time-1D-depth graphs that overlap a certain sub-range of time, typically one-quarter of the plotted range, for the entire period of measurements and then mounting all these graphs in a faster than real-time displayed video.
Open-ocean measurements show constantly varying stratification but fairly smooth internal waves, as observed in the Canary Basin, Northeast-Atlantic Ocean (video 1). These data are from temperature sensors at 2.5 m vertical intervals between 1390 and 1520 m in 5100 m water depth, well away from any bottom topography. Video 1 contains 3 panels spanning different time-ranges: 24 hours, 8 hours and 2 h 40 min. Video 2 is the middle panel alone.
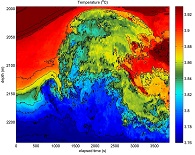
Measurements 200 m below the top of an underwater extinct volcano, Great Meteor Seamount, at the edge of the Canary Basin show breaking internal waves. (Note that the colour range is fixed with occasional warmer and cooler temperature outside the bounds). Attached to a cable above a bottom lander at 550 m water depth, 100 sensors were 0.5 m apart and reached to within 0.5 m from the bottom. The data show breaking waves up to 50 m above the bottom and passing within a minute (video 3). These waves are so turbulent that they sweep-up sediment 1000 times better than bottom friction by tidal currents in the area. Also, small-scale turbulence is seen throughout the rest of the wave period. Note that the tidal excursions are well exceeding the 50-m vertical measurement range, by a factor of two approximately.
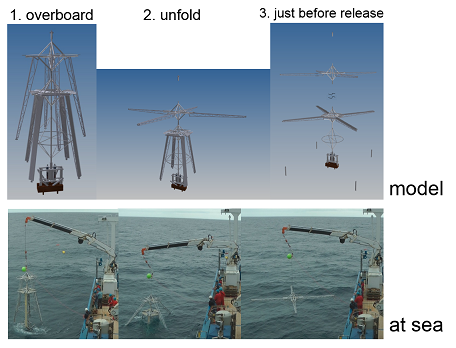
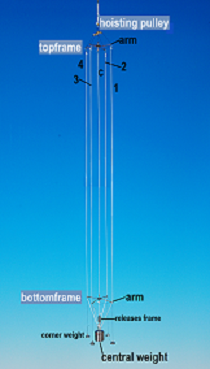
The above image and videos are from 1D (vertical) arrays, but internal wave – turbulence processes are essentially 3D. A successful attempt to launch a 3D single-go mooring array to investigate their development in a rudimentary way was made in May 2015 (video 1 below), a second deployment using improved cables in November 2017 (video 2 below). This NIOZ-development consists of 5 mooring lines, 100 m long, 4 (and 5.6) m apart horizontally and can hold up to 530 temperature sensors. It is transported in compact (folded) form to fit in a 20 foot seacontainer, to be unfolded overboard just prior to deployment (see below).
Video of deployment 1 Video of deployment 2